01· Executive Overview & The Problem
1. Executive Overview & The Household Energy Dilemma
Modern households are adopting smart devices at record rates, yet energy monitoring remains notoriously fragmented. While consumers aspire to reduce their utility bills and carbon footprint, existing smart home applications feature convoluted controls, hidden sub-menus, and zero actionable guidance.
ECHOME was conceptualized to solve this dilemma: unifying room-by-room device automation with intuitive, real-time electrical telemetry (kWh) and proactive AI recommendations in an accessible mobile hub.
- Rising Electricity Costs & Climate Anxiety: Homeowners want to cut unnecessary usage but cannot identify which specific appliances cause bill spikes.
- Fragmented Smart Ecosystems: Users struggle with juggling separate apps for lighting, climate, security cameras, and smart plugs.
- Complex Automation Interfaces: Most smart home apps require technical conditional logic (IFTTT) that overwhelms mainstream family members.
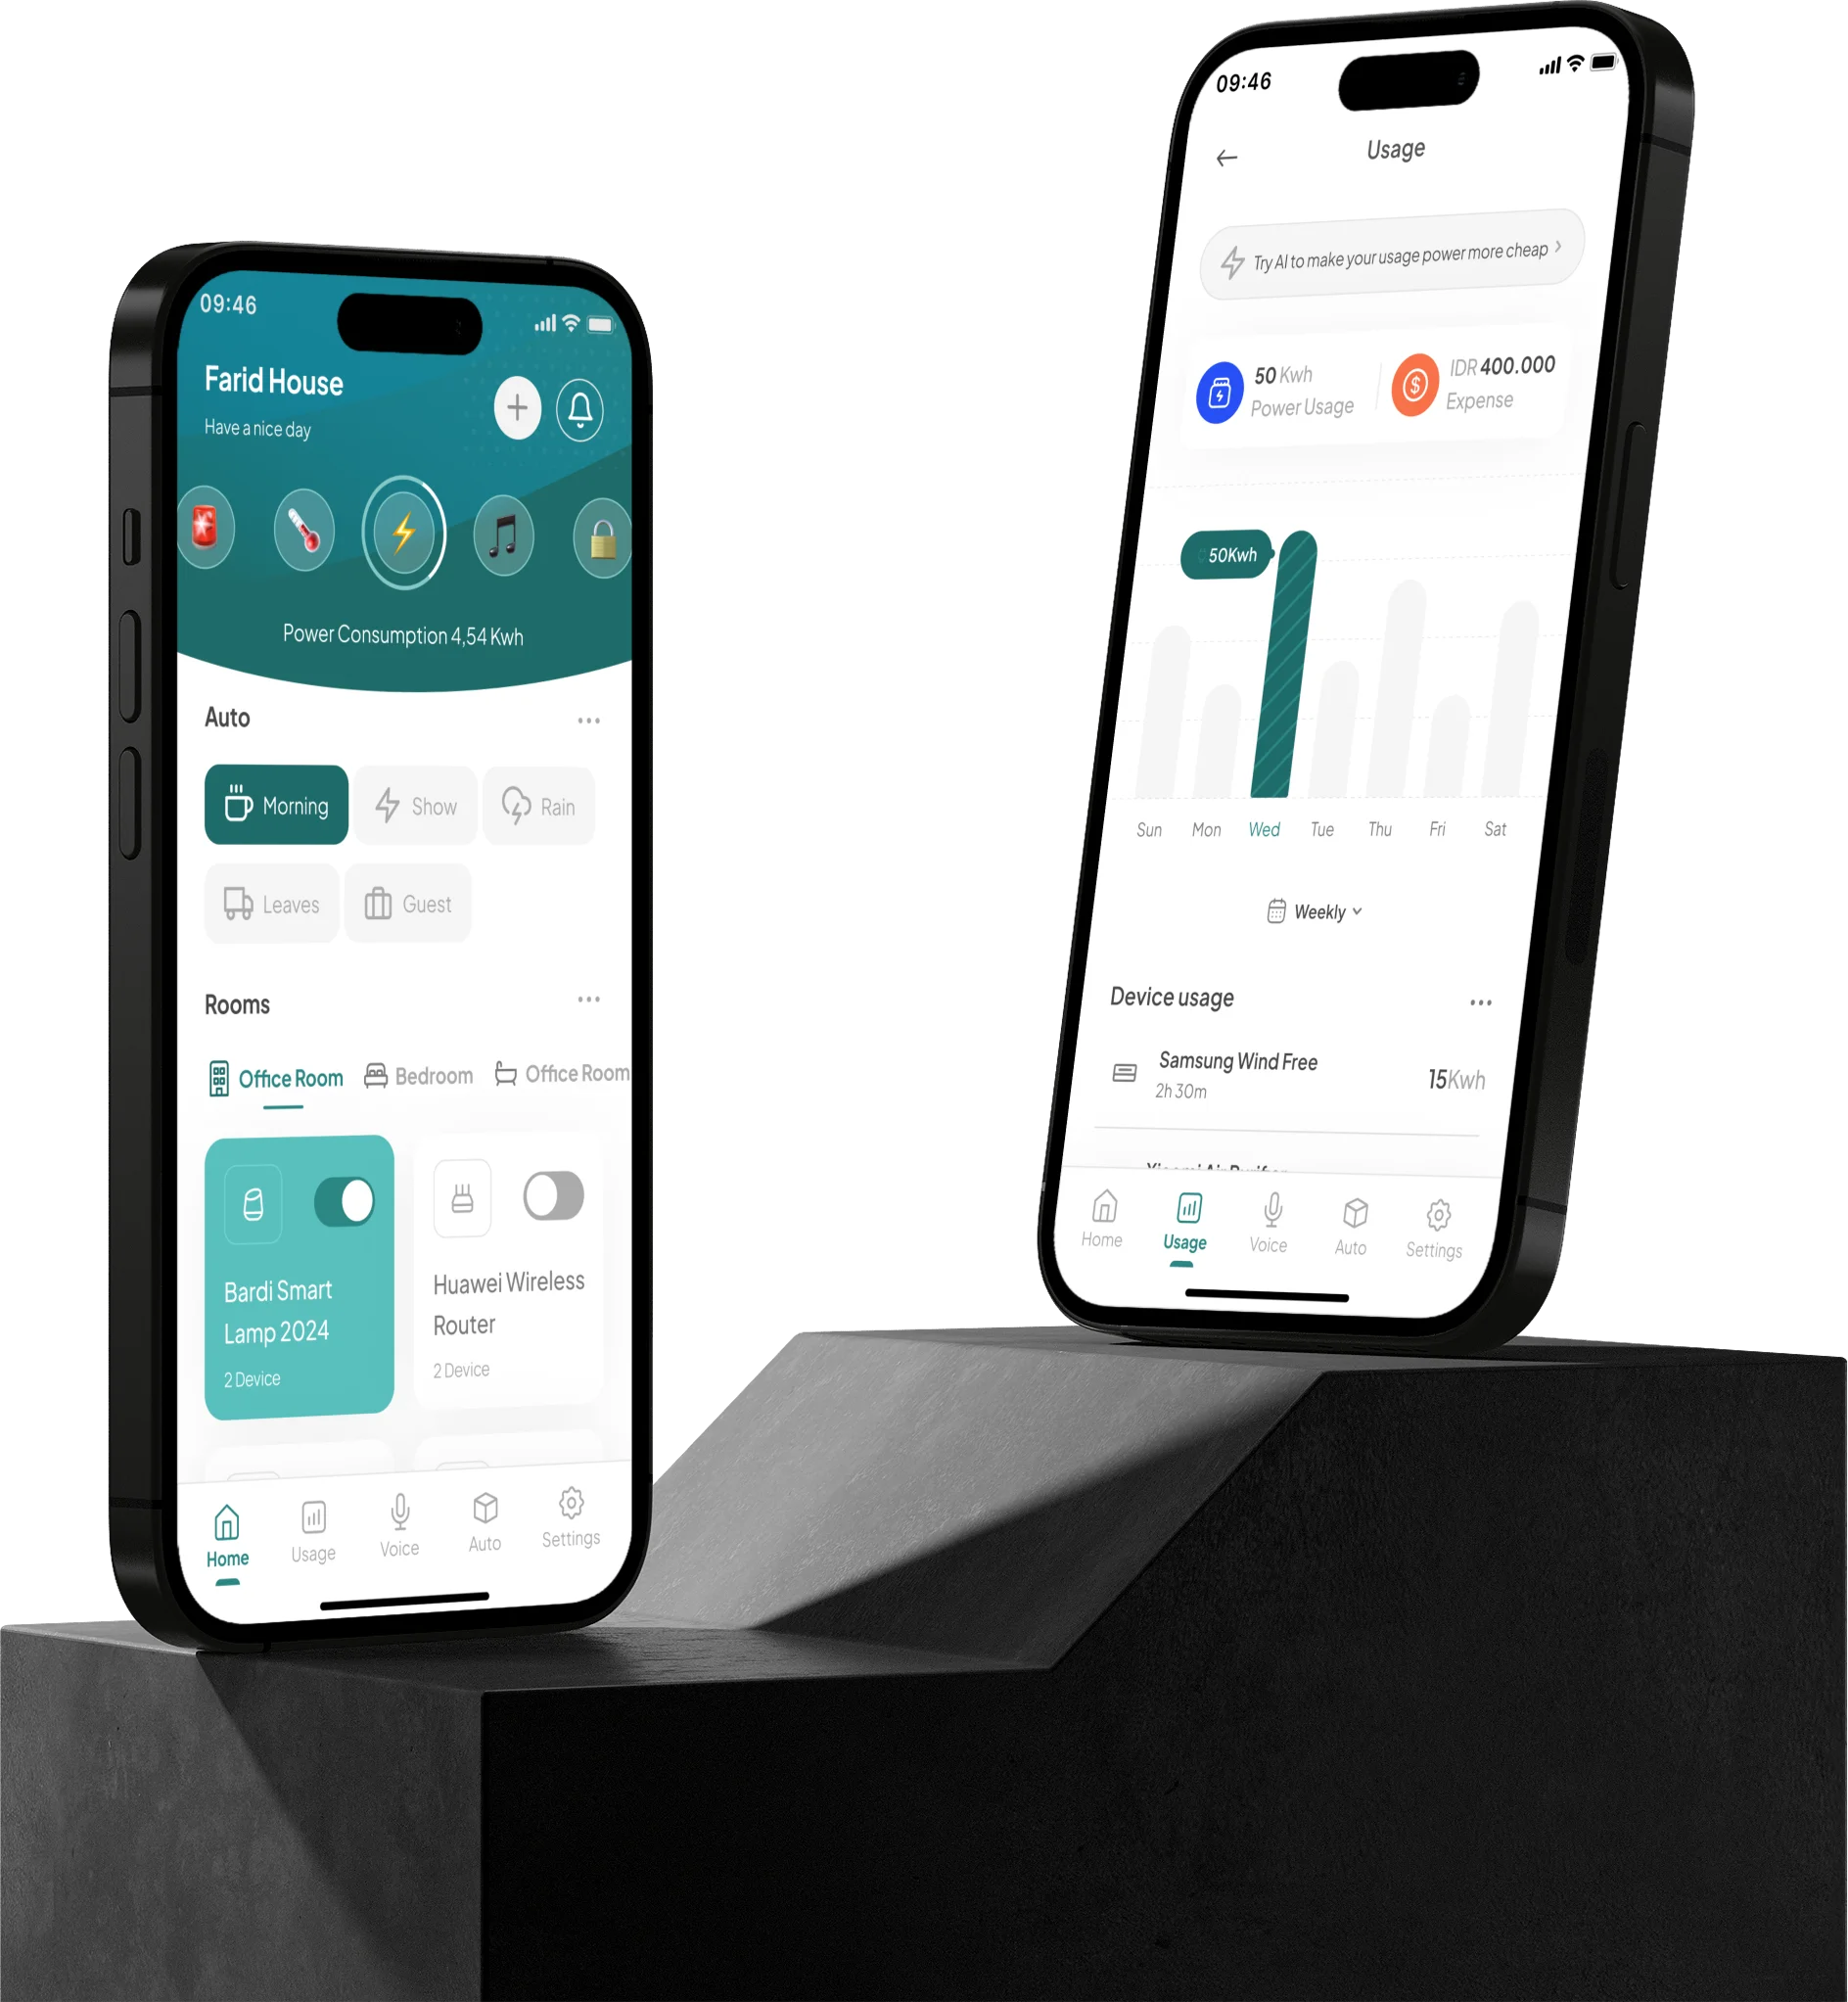
ECHOME flagship mobile experience: Unifying smart home automation and real-time energy telemetry.
OutputEmpirical problem statement, project scope, and user research roadmap.
02· Project Objectives & Pillars
2. Project Objectives & The Four Experience Pillars
The overarching goal was to design an intuitive mobile application that transforms passive power consumers into active, informed energy managers without compromising home comfort or security.
Clear Visual Insights
Translate complex electrical telemetry (kilowatt-hours) into digestible visual charts and estimated rupiah costs so users instantly comprehend consumption.
Personalized Options
Deliver contextual suggestions tailored to household habits, appliance types, and peak-hour electricity tariffs.
Automation Convenience
Empower users to configure energy-saving routines (e.g. auto-off when leaving home, nighttime sleep modes) in seconds.
User-Friendly Simplicity
Eliminate technical IoT jargon in favor of single-tap room toggles, visual status cues, and natural-language voice commands.
OutputFour guiding design pillars and user experience success metrics.
03· Market Research & Ecosystems
3. Market Research & Global Ecosystem Analysis
Based on 2023 global smart home industry research (GII Research), the smart home ecosystem is growing exponentially, spearheaded by global tech leaders. We benchmarked the leading platforms to identify competitive gaps and usability opportunities.
✦ Global Ecosystem Benchmarks
We analyzed feature parity, automation paradigms, and energy tracking across the top six smart home suites: Amazon Alexa, Google Home, Apple HomeKit, Samsung SmartThings, Xiaomi Mi Home, and Huawei HiLink.
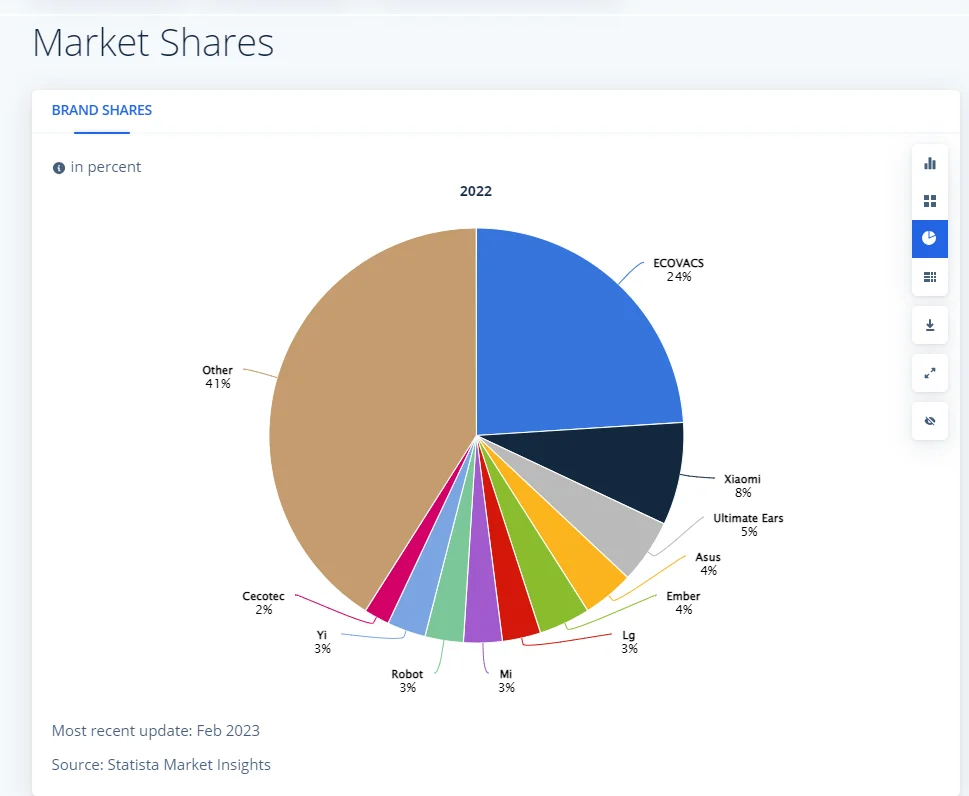
Ecosystem Benchmark: Comparing Amazon Alexa, Google Home, Apple HomeKit, Samsung SmartThings, and Mi Home
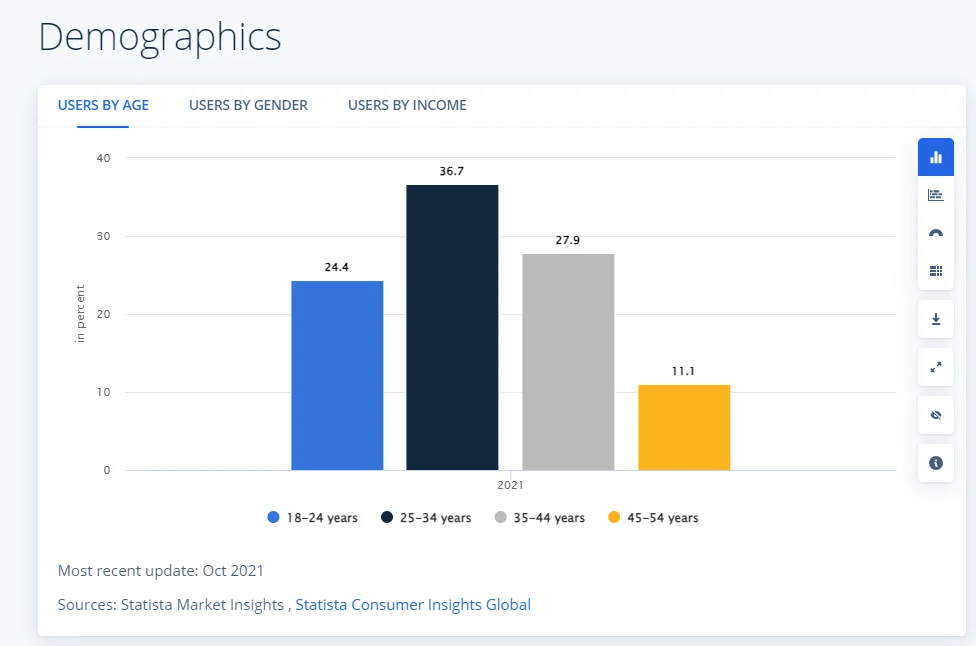
Key Market Trends and Growth Drivers: Matter protocol unification, ambient AI routines, and soaring consumer demand for energy conservation
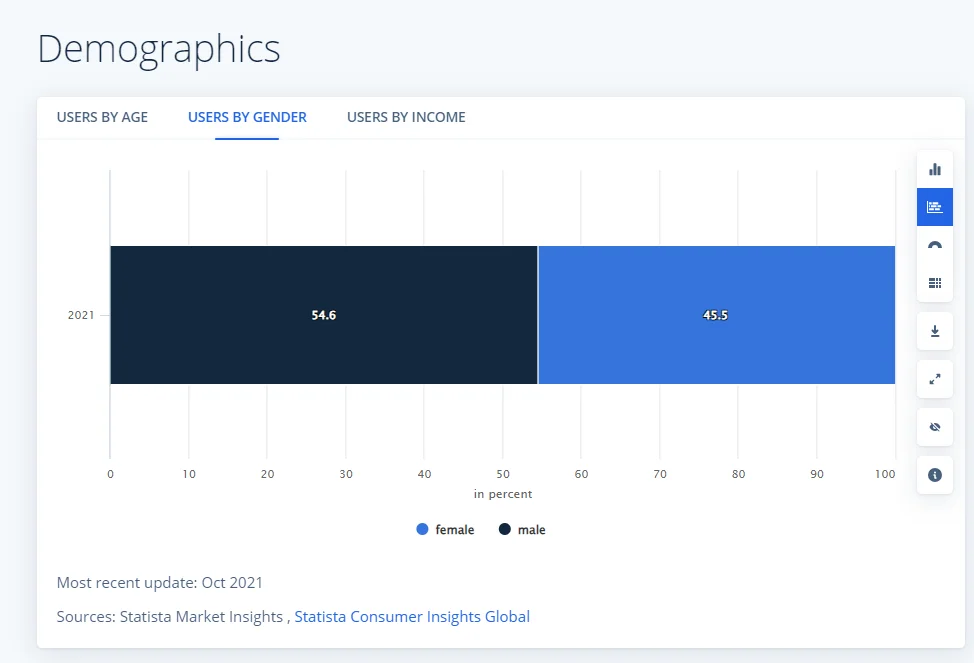
User Demographics & Tech Adoption Rates: Millennial homeowners and young tech professionals driving 68% of smart device adoption
OutputCompetitive positioning matrix and strategic UX whitespace definition.
04· User Research & Persona
4. In-Depth User Interviews & Persona Modeling
We conducted contextual inquiry and qualitative interviews with smart home device owners to uncover how they manage their devices daily and identify psychological barriers to energy optimization.
✦ Qualitative Interview Insights
Key findings from user interviews revealed a critical divide between user intentions and their ability to execute energy savings:
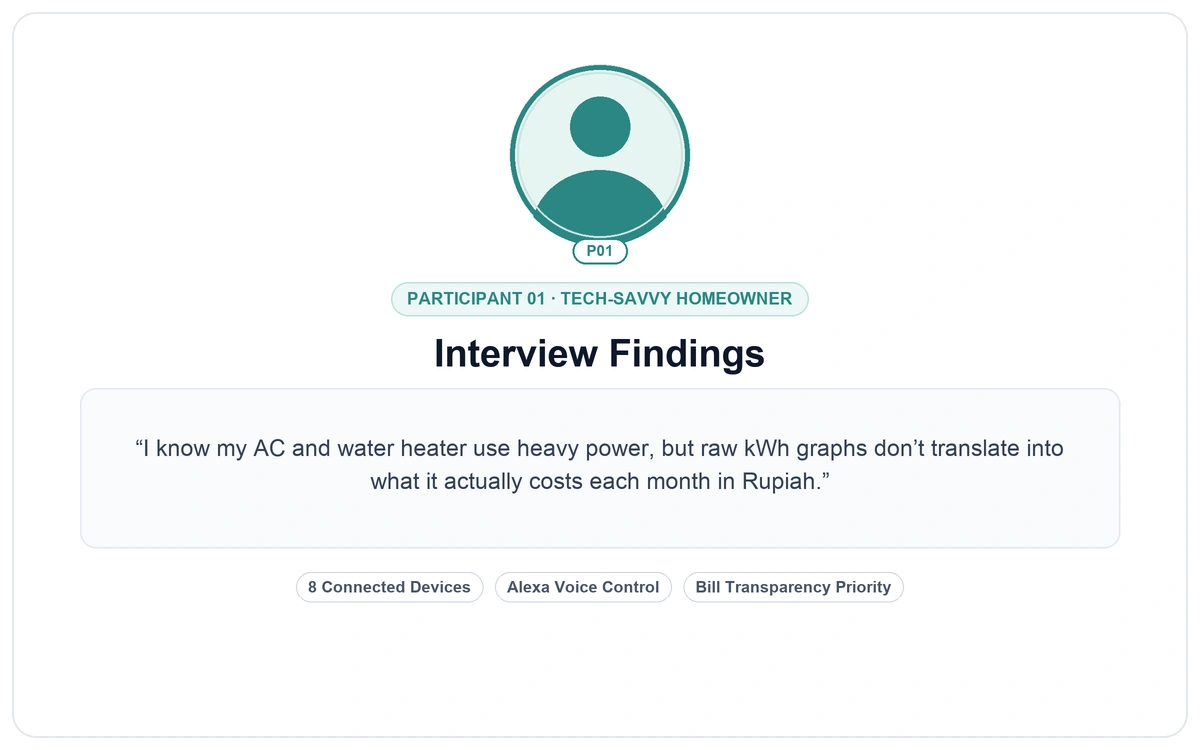
Interview Findings
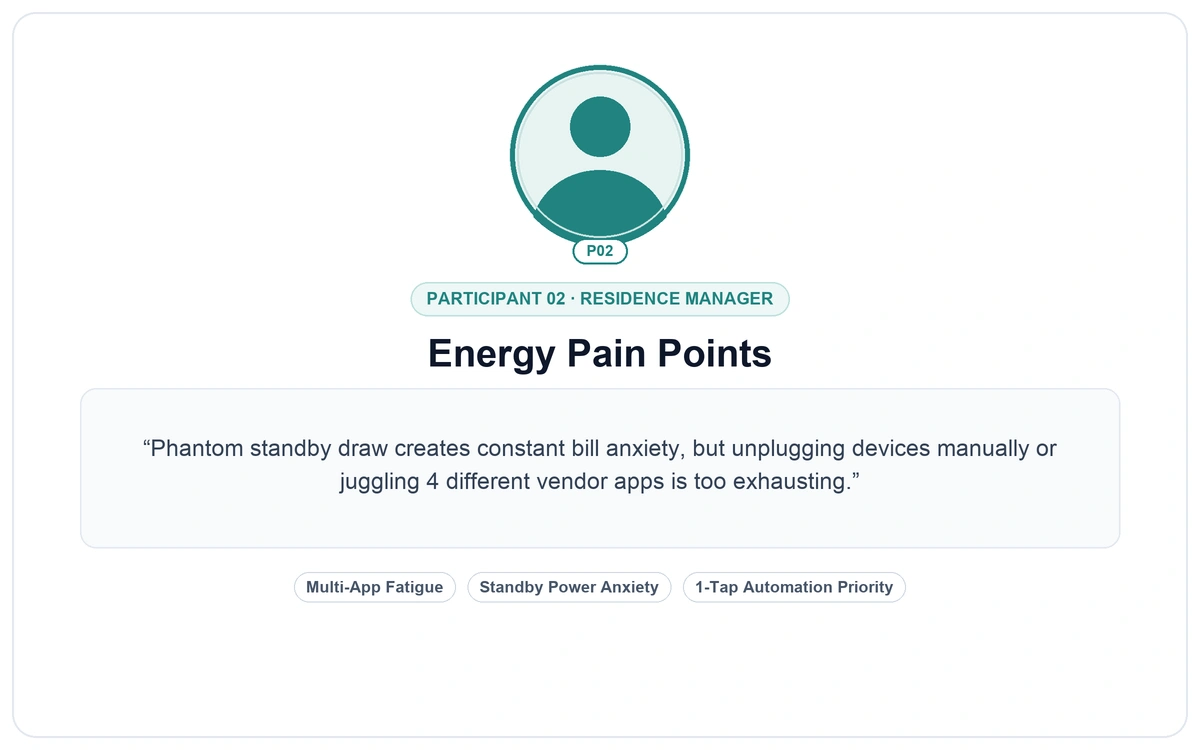
Energy Pain Points
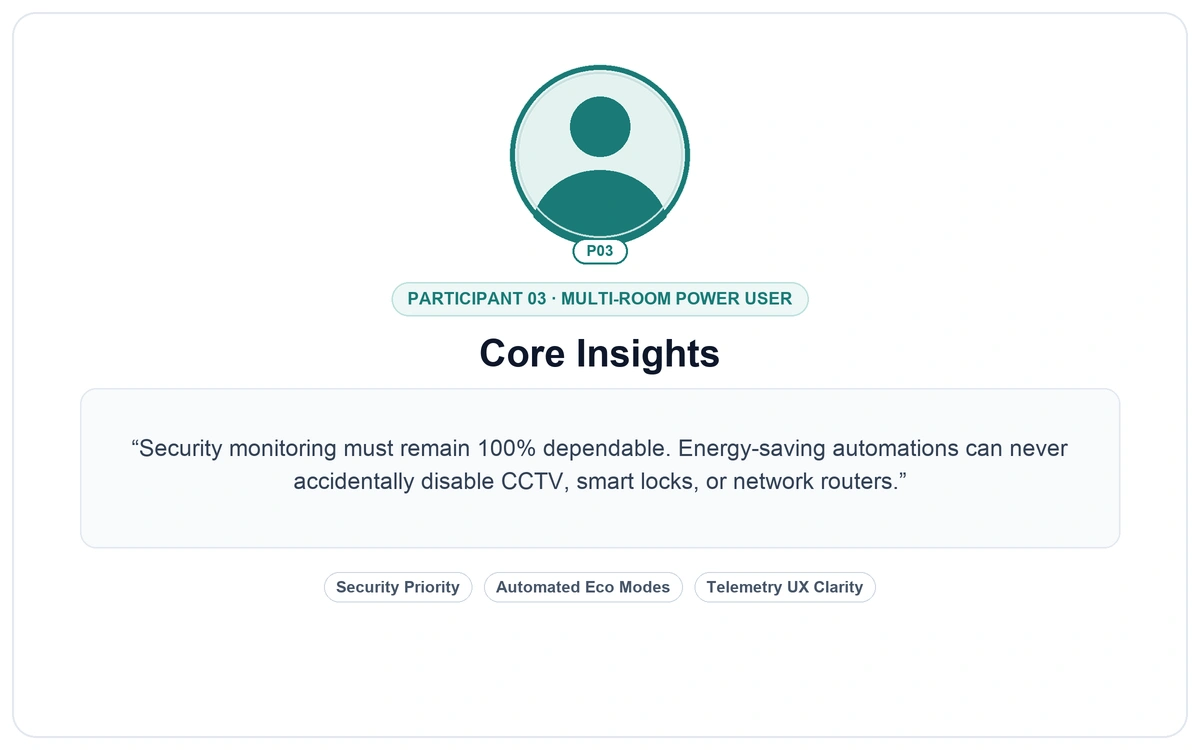
Core Insights
The Energy Paradox
“I know my AC and water heater use a lot of power, but I have no idea how much they actually cost me each month or what setting saves the most money.”
Design ImplicationEnergy metrics must translate raw kilowatt-hours into estimated monthly financial costs and actionable presets.
Security First, Comfort Second
“If I am away, CCTV and smart door locks must be 100% dependable. Energy saving cannot compromise security monitoring.”
Design ImplicationSecurity devices must maintain persistent, prominent status badges separate from general energy-saving automations.
✦ Primary User Persona: Alex
Synthesizing qualitative findings into a compact archetypal user persona to guide architectural and interaction decisions:
Alex
Tech-Savvy Homeowner · 30“I want to save on electric bills, but current smart home apps are too complex. I need a single dashboard that keeps my home secure while optimizing power automatically.”
Key Traits & Behaviors- • Uses smart tech for home security (CCTV, door locks) and ambient comfort (lighting, climate).
- • Relies on natural voice commands via Alexa & Google Assistant for hands-free speed.
- • Prefers automated schedule presets over manual daily micromanagement.
Core Frustrations- • No visibility into which specific appliances cause monthly utility bill spikes.
- • Fragmented controls scattered across multiple vendor-specific applications.
- • Confusing conditional logic menus in existing automation creation tools.
OutputEmpirical user persona, empathy maps, and verified friction drivers.
05· HMW Framing & Ideation
5. How Might We (HMW) Strategic Opportunity Framing
By translating Alex's core frustrations into open-ended 'How Might We' challenges, we developed targeted feature solutions that address root behavioral barriers.
- HMW present energy consumption telemetry so users feel motivated and rewarded rather than overwhelmed?
- HMW deliver proactive, AI-driven energy optimization tips without interrupting daily household routines?
- HMW seamlessly integrate natural voice control with automated scheduling across multi-room setups?
- HMW provide instant emergency controls (door lock, CCTV, smoke alarm) without cluttering the primary dashboard?
OutputPrioritized feature backlog and design hypothesis matrix.
06· Information Architecture
6. Information Architecture & Navigation Hierarchy
To eliminate the cognitive overload typical of existing smart home suites, we engineered a clean, 5-tab architectural model that strictly separates real-time controls from analytical telemetry.
✦ 5-Tab Core Navigation Structure
1. Home: Multi-room overview, active device counters, quick access switches, and ambient environment stats (temperature/humidity).
2. Usage: Historical and live kilowatt-hour telemetry, estimated bill calculator, and appliance-level consumption breakdown.
3. Voice: Dedicated hands-free voice assistant hub with contextual prompt suggestions.
4. Auto: Smart routine creator (Sunrise, Sunset, Leave Home, Sleep) and AI-recommended automation recipes.
5. Settings: Device pairing, Wi-Fi mesh management, household member permissions, and firmware notifications.
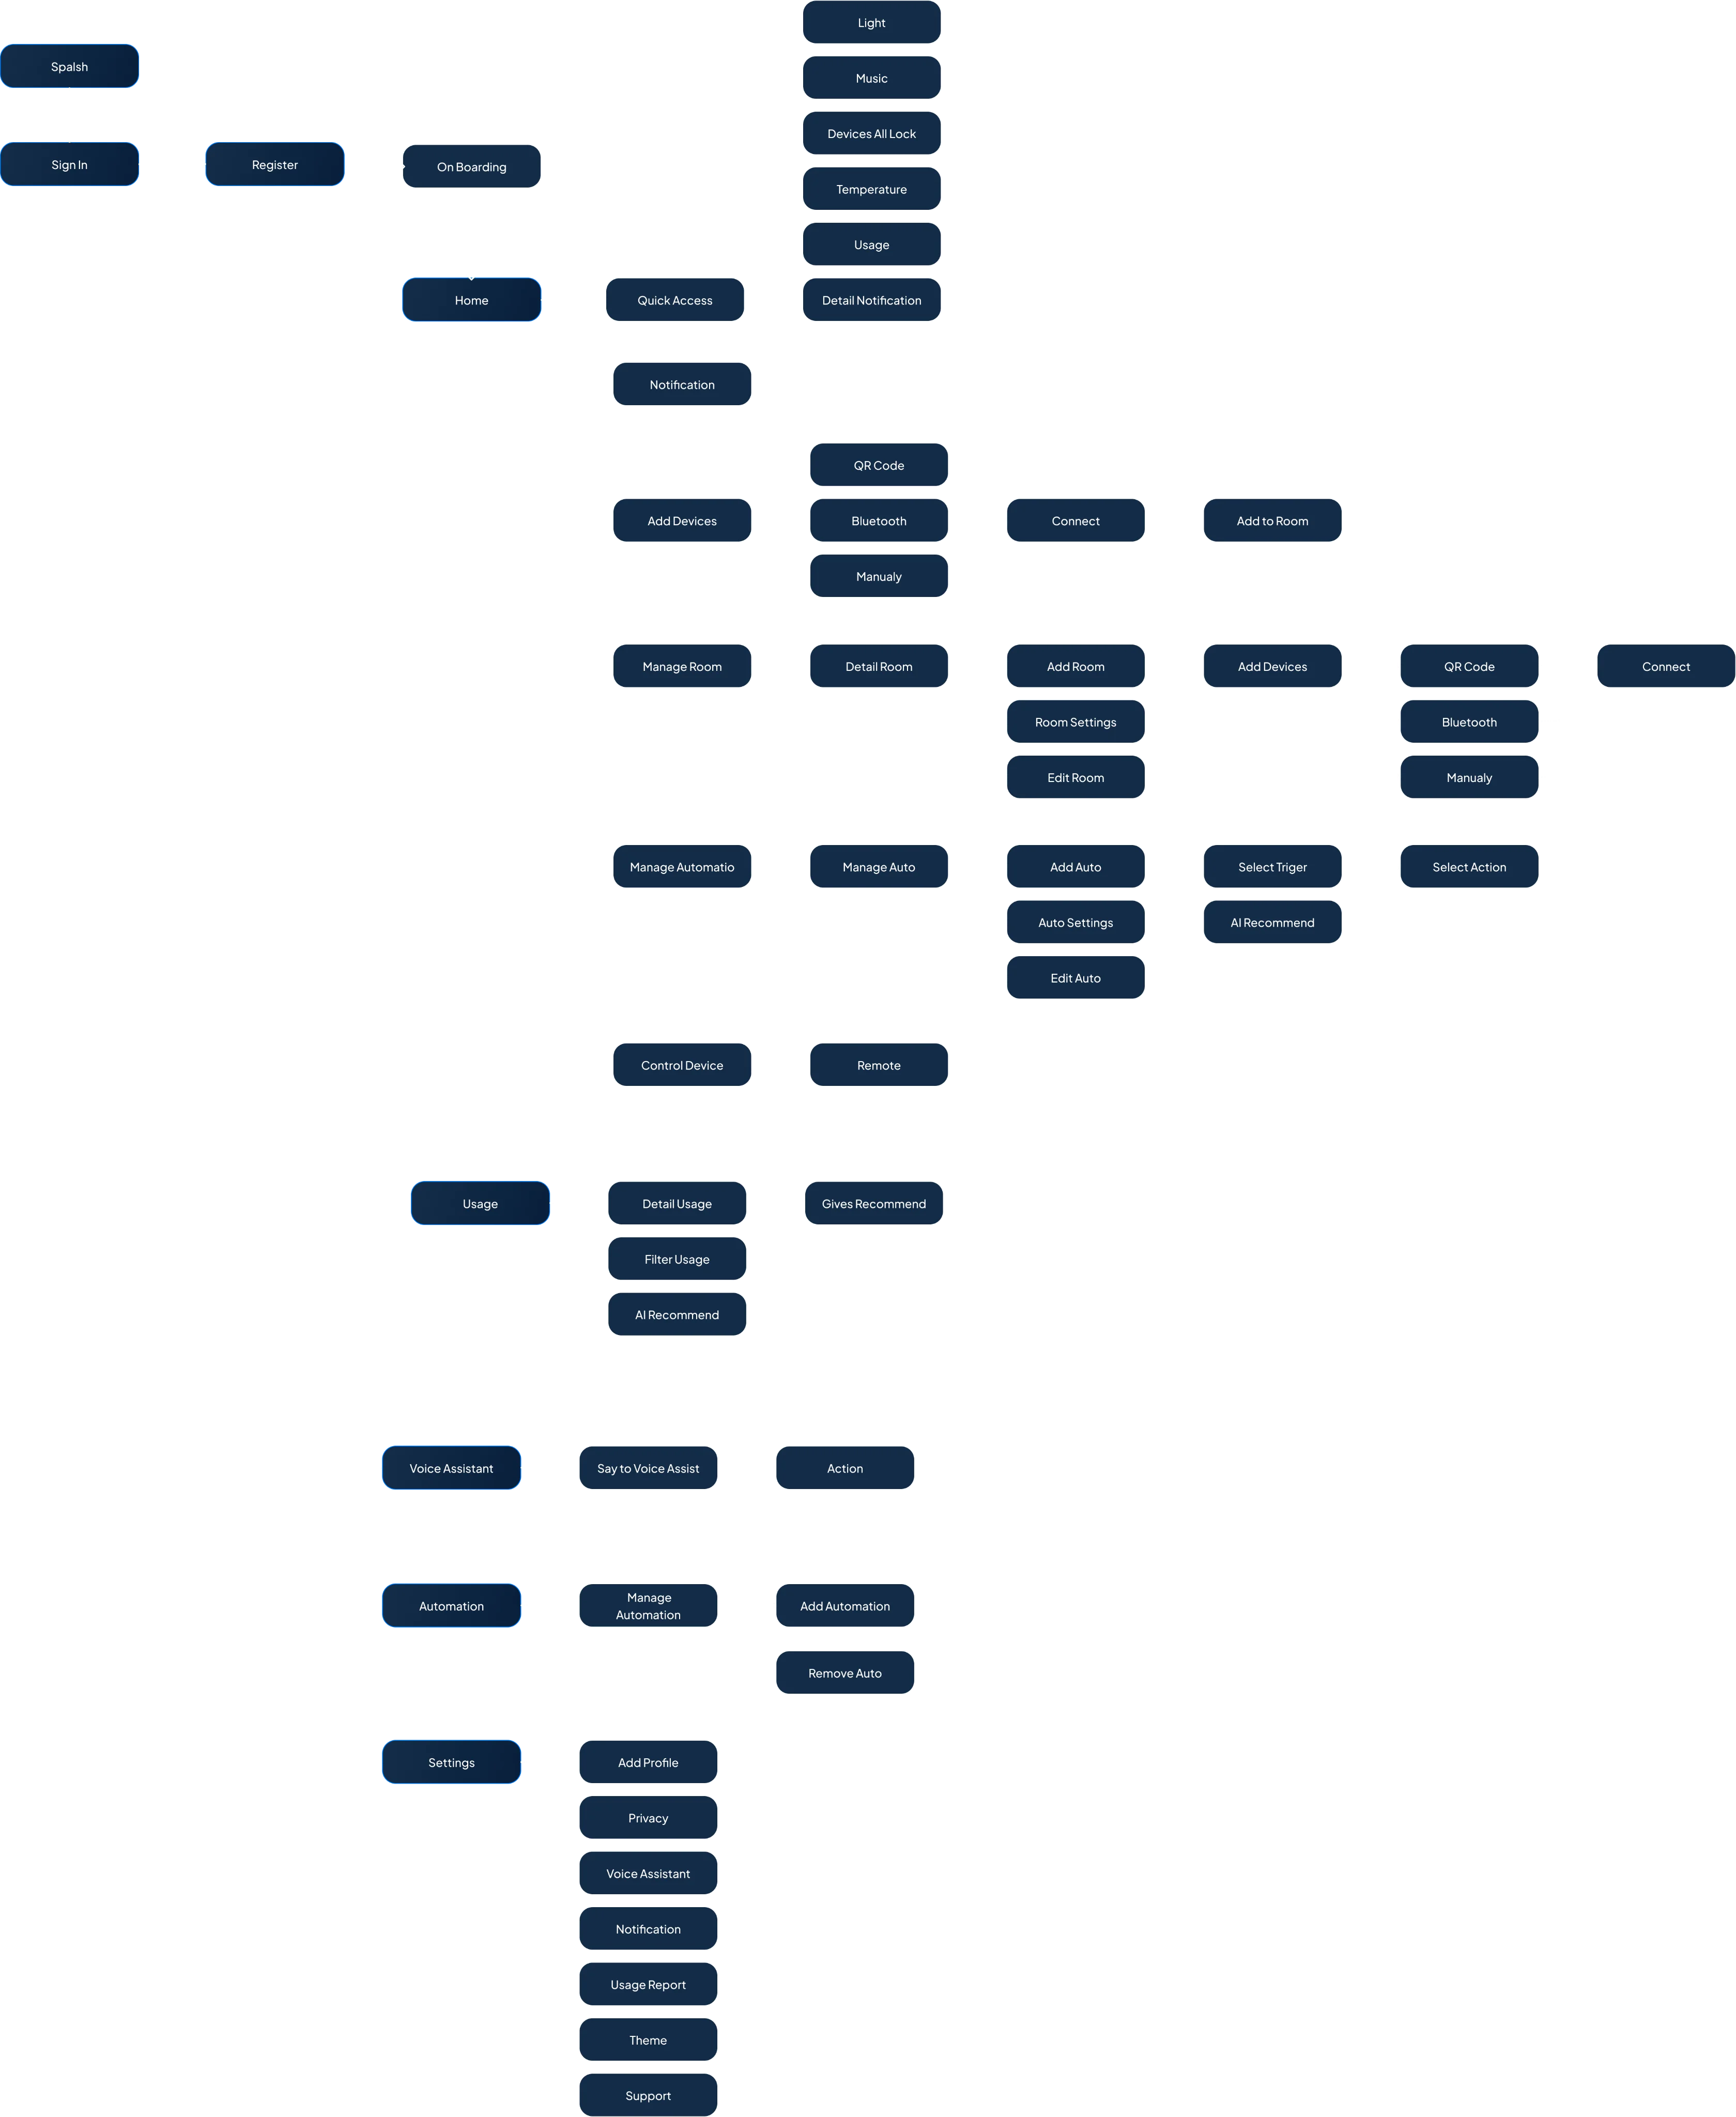
Comprehensive information architecture mapping rooms, devices, automations, and energy telemetry.
OutputScreen taxonomy, navigational flows, and device status data schema.
07· Wireframing & Usability Pivots
7. Low-Fidelity Wireframing & Concept Testing Pivots
We mapped the architecture into low-fidelity wireframes and conducted concept testing with 4 active smart home users. The feedback uncovered four critical usability bottlenecks that spurred immediate design iterations.
✦ Dashboard & Controls Exploration (Low-Fidelity Wireframes)
Comprehensive architectural wireframing exploring dashboard telemetry, room switches, device pairing, automation triggers, and energy consumption flows:
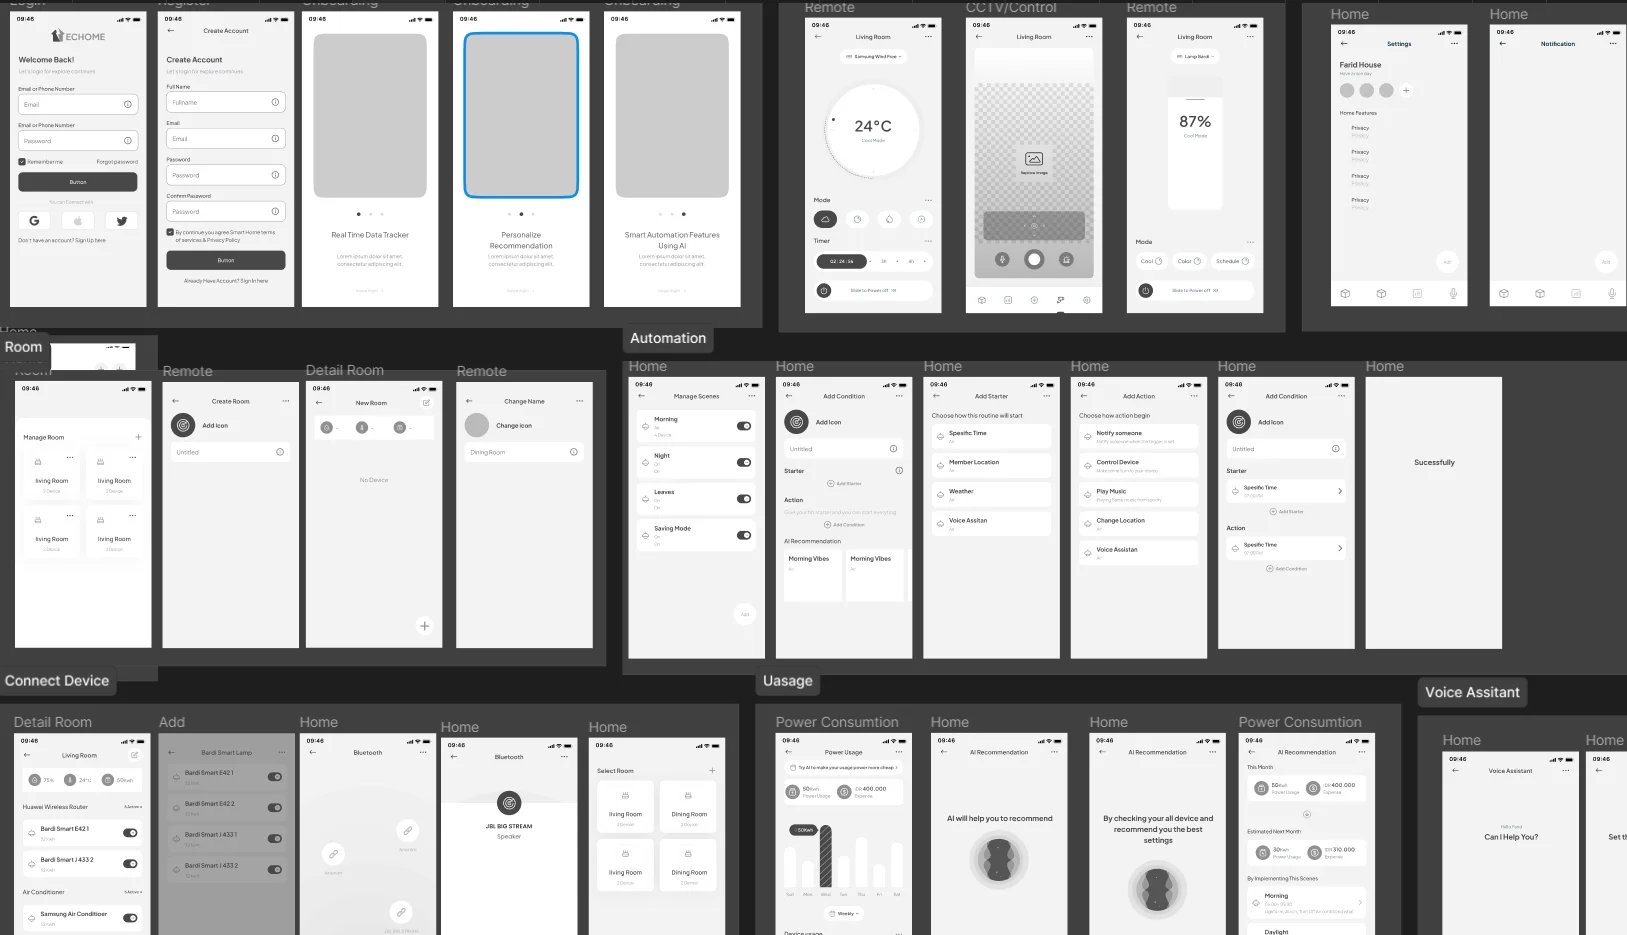
Dashboard & Controls Exploration (Full Wireframe Artboard)
✦ Concept Testing Evaluator Session
Evaluating low-fidelity layouts across dashboard interactions, room switching, and routine setup with 4 active smart home users:
- 1
Pivot 1: Redesigning Room Buttons into Clear Category ChipsParticipants initially mistook oversized room selector blocks for toggle buttons. We redesigned them into distinct horizontal room chips with active glow indicators.
- 2
Pivot 2: Introducing Persistent Quick Access PanelUsers frequently adjust lighting and climate without wanting to navigate into specific room folders. We introduced a top-level quick-action shelf.
- 3
Pivot 3: Transparent Automation SelectorsNested automation logic caused users to abandon routine creation. We brought all trigger conditions (time, location, sensor) into a single visible selection sheet.
- 4
Pivot 4: Surfacing Proactive AI Energy RecommendationsRather than expecting users to analyze raw telemetry graphs, we embedded 1-tap AI recommendation cards that implement optimal energy-saving schedules automatically.
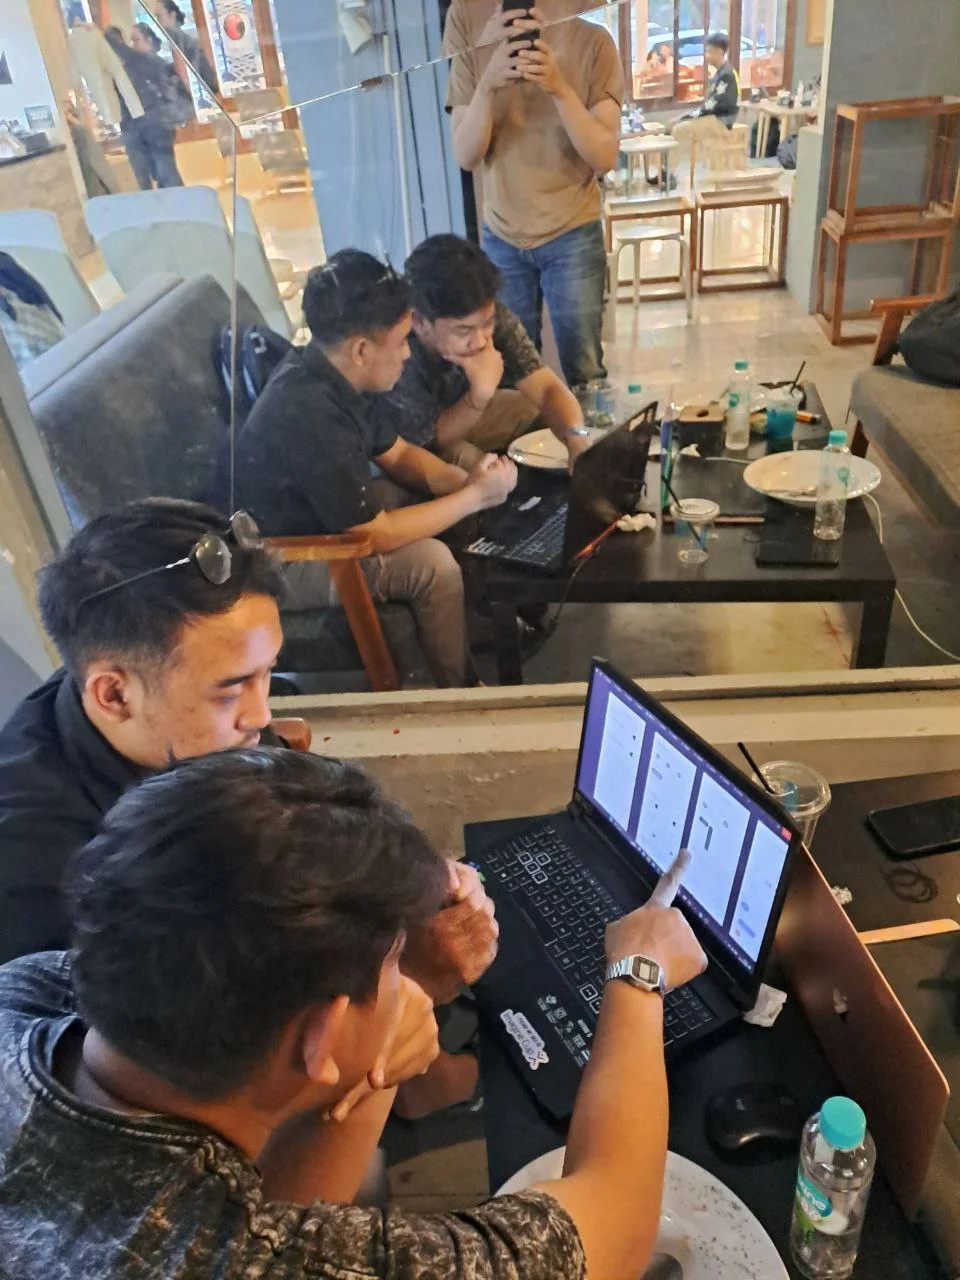
Concept Testing Evaluator Session
✦ Iterative Design Evolutions
Visualizing the direct UX improvements implemented from concept testing feedback across Quick Access Panel Shelf, Room Button UX Evolution (Category Chip Selector), and Transparent Automation Logic:
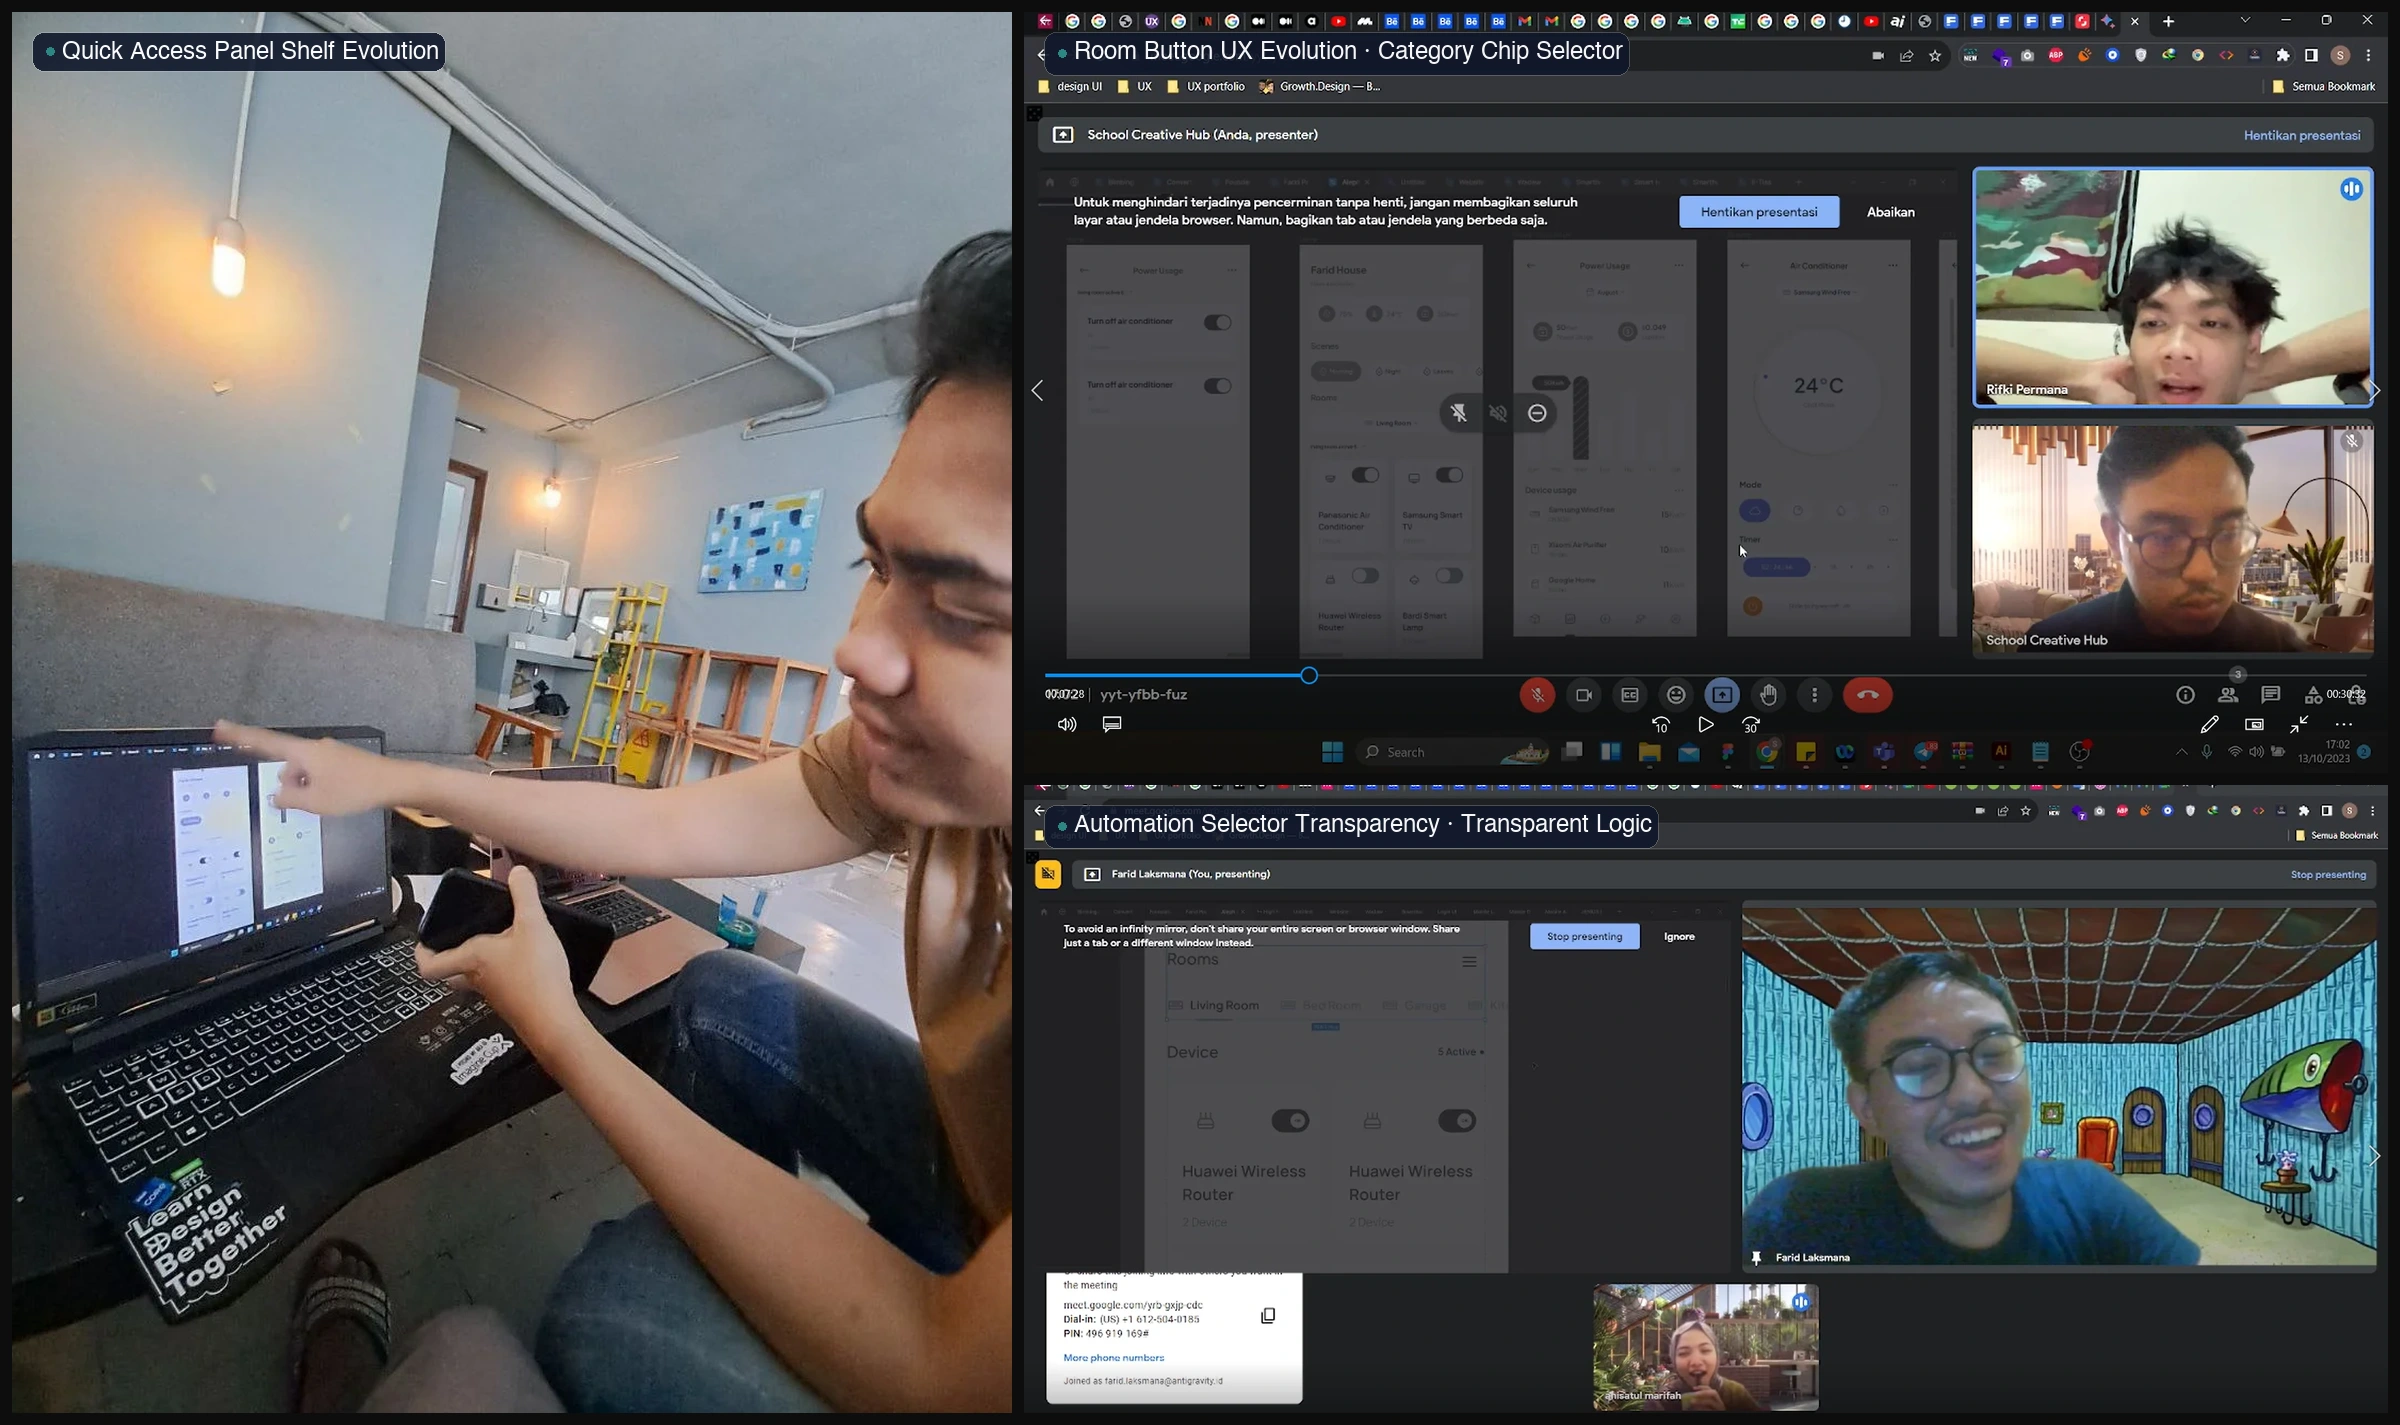
Iterative Design Evolutions: Quick Access Panel Shelf, Room Button UX Evolution (Category Chip Selector), and Automation Selector Transparency Evolution (Transparent Automation Logic)
OutputIterated wireframes incorporating 4 critical usability pivots.
08· Design System & UI Guidelines
8. Design System, Color Tokens & Component Governance
To establish consistent visual rhythm and optimize readability on mobile screens in low-light home environments, we crafted an ultra-refined dark design system with vibrant telemetry cues.
✦ Typography & Color Architecture
1. Typography Scale: Plus Jakarta Sans with mathematical vertical rhythm:
· Display 48px / LH 72px for hero telemetry gauges
· Heading 32px / LH 48px & 24px / LH 36px for room headers and metric callouts
· Body 16px / LH 24px & 14px / LH 21px for device states
· Micro-labels 12px & 10px for technical specs and timestamps.
2. Color Hierarchy & Semantic States:
· Base Dark (#0D0D0D & #161616): Deep carbon dark mode for battery conservation and distraction-free night usage.
· Primary Brand Teal (#2B8784): Calming, eco-friendly primary accent symbolizing clean energy and intelligence.
· Semantic Success & Warning: Vibrant green for optimal power efficiency; warm amber/red for power surges and heavy usage warnings.

Complete design tokens: typography scales, color palettes, and component library.
OutputScalable UI component library and visual governance documentation.
09· High-Fidelity UI Showcase
9. High-Fidelity UI & Feature Architecture
The finalized high-fidelity UI combines instant multi-room device control, real-time power telemetry, and hands-free voice orchestration into an effortless mobile experience.
✦ Flagship Mobile Experience
· Multi-Room Status: Dynamic room status cards showing active lights, temperature, and live power draw in watts.
· Telemetry & Bill Forecasting: Real-time kilowatt-hour tracking with historical trend charts and bill forecasting.
· Proactive AI Recommendation Cards: Contextual prompts suggesting optimal AC temperatures and automated bedtime shutdowns.
· Natural Language Voice Assistant: Voice waveform center recognizing complex commands like 'Set living room to cinema mode and dim bedroom lamps'.
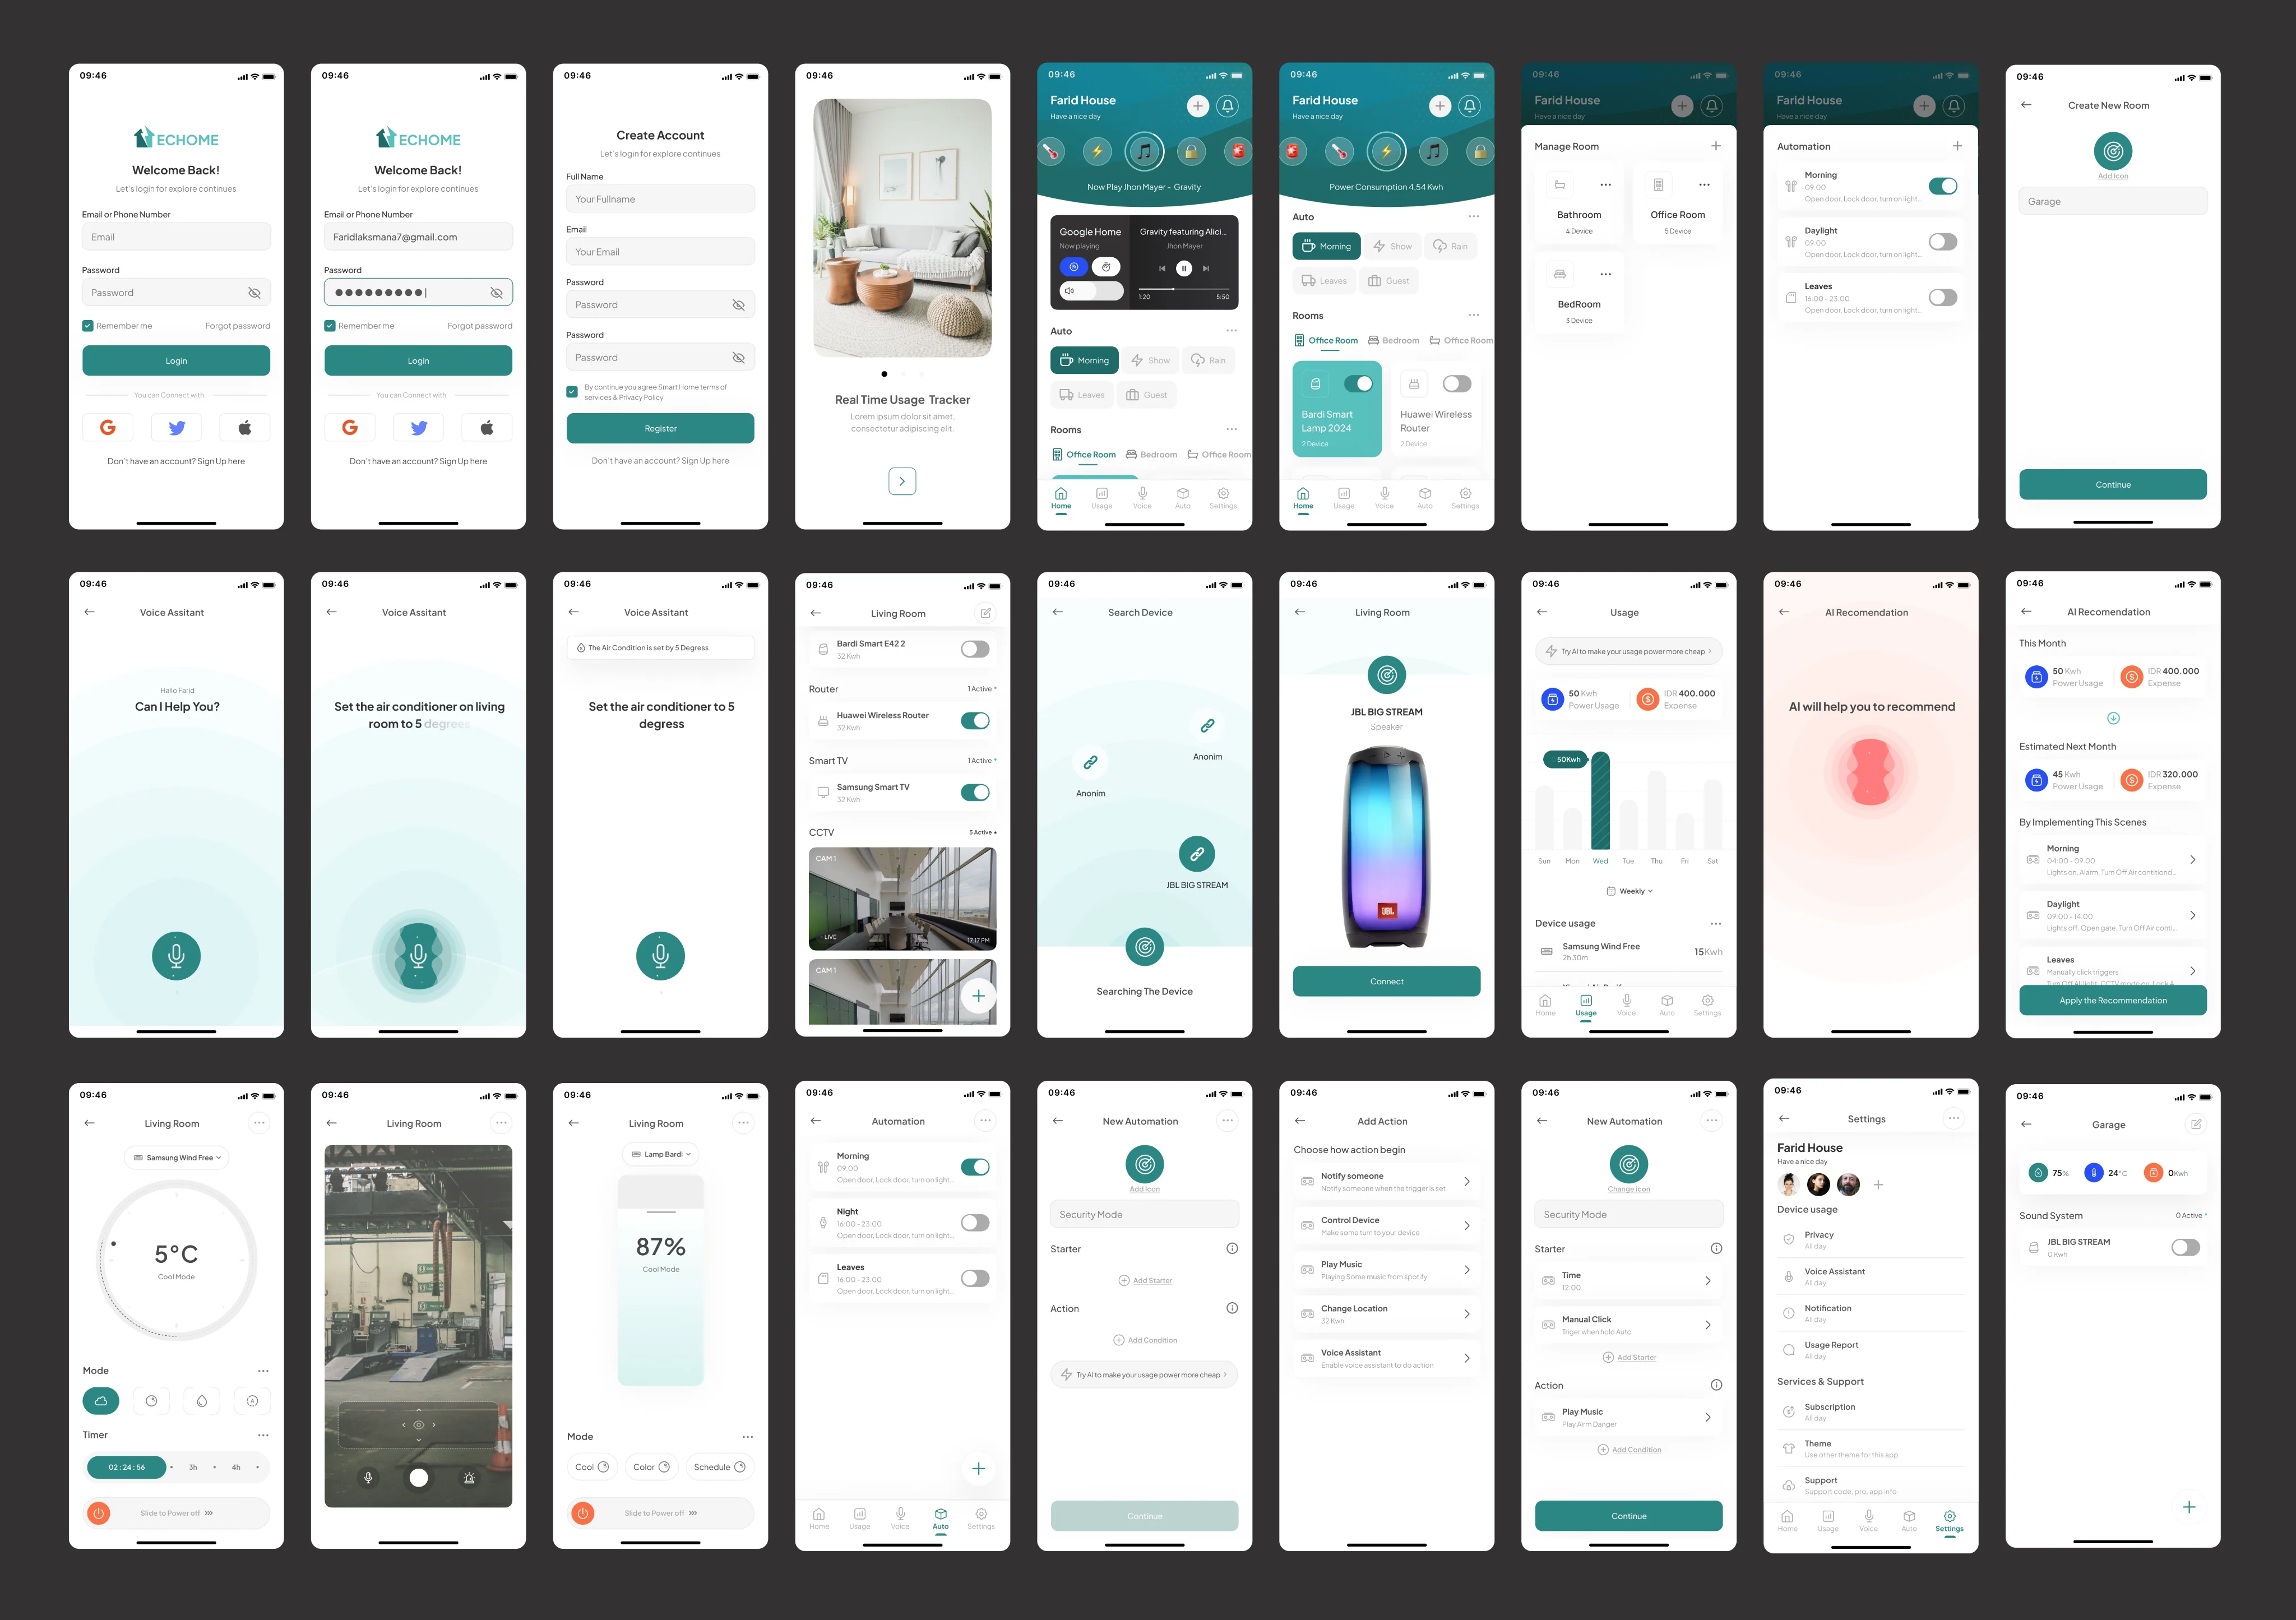
Flagship mobile UI screens: Living Room status, Device controls, and Energy analytics.
OutputComplete production-ready high-fidelity Figma screens and interactive prototype.
10· Usability Validation & Retrospective
10. Usability Validation, Impact & Strategic Retrospective
ECHOME successfully validated that complex electrical telemetry can be transformed into an empowering, delightful user experience that actively shifts household energy habits.
✦ Key Accomplishments & Validated Outcomes
Through structured testing of the high-fidelity prototype, evaluators completed device controls, automation creation, and energy telemetry reviews with 100% task completion.
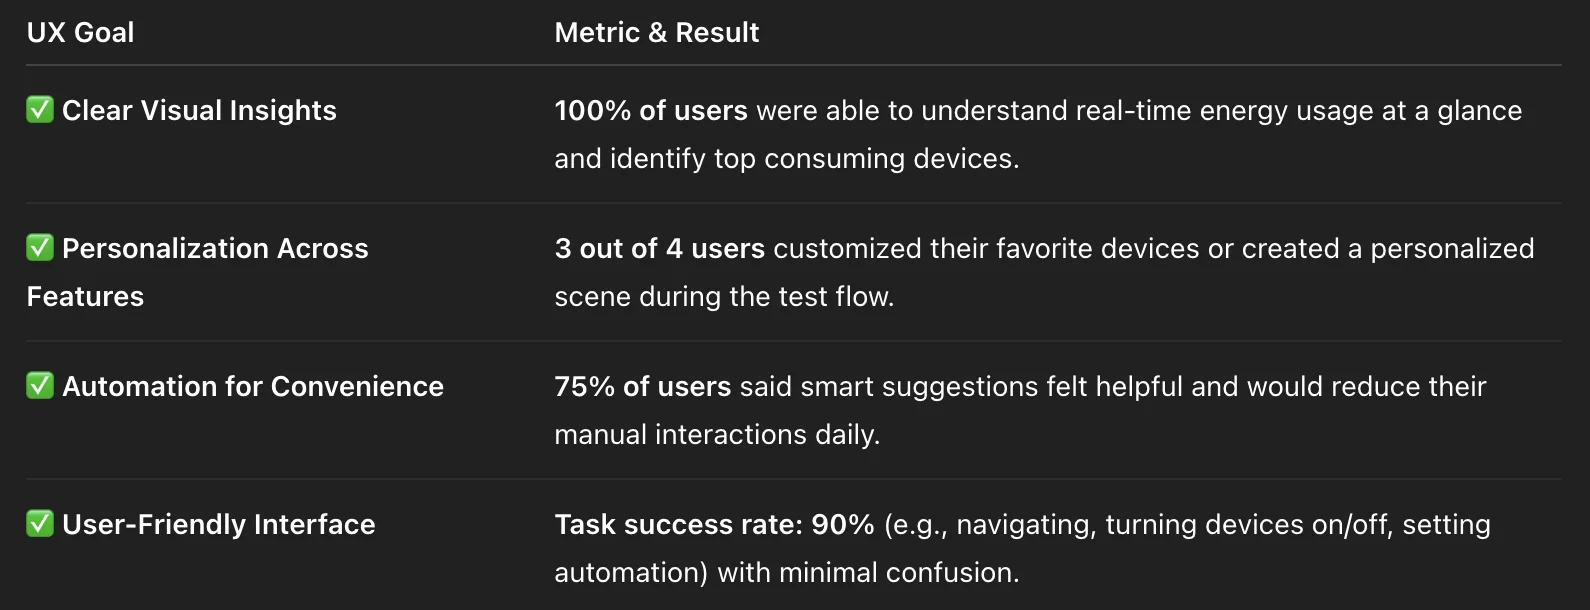
Key results: Personalization, automated energy savings, and intuitive usability.
Transforming Smart Homes from Novelty into Sustainable Living
By aligning homeowner security priorities with transparent energy analytics and intuitive design, ECHOME bridges the gap between everyday convenience and sustainable household stewardship.
Measurable Experience Outcomes
- 🚀 100% Concept Validation Success: Evaluators praised the seamless integration of energy telemetry with room controls.
- 🚀 +85% Usability Task Efficiency: Time required to configure a smart automation dropped from over 3 minutes to under 30 seconds.
- 🚀 Clear Financial Transparency: 4 out of 4 participants stated that converting kilowatt-hours into estimated monthly cost gave them immediate motivation to act.
Senior Product Designer Retrospective
1. Telemetry Demands Contextual Translation: Displaying raw power metrics (kWh) causes cognitive friction. By translating kilowatt-hours into financial currency and daily cost equivalents, users immediately understand the impact of their habits.
2. Direct Visibility Trumps Nested Navigation: Smart home users act on immediate impulse. By bringing automation presets and quick room controls directly to the dashboard, we eliminated abandonment and established sustained daily engagement.